AT-ST Mass Report
By: Joseph Cho (Mission, Systems, and Testing)
Verified By: Intiser Kabir (Project Manager)
Approved By: Miguel Garcia (Quality Assurance)
Table of Contents
Introduction
This blog post will show the mass of the AT-ST and include the ways that the masses have been initially estimated. All of the parts have been measured for the final mass report.
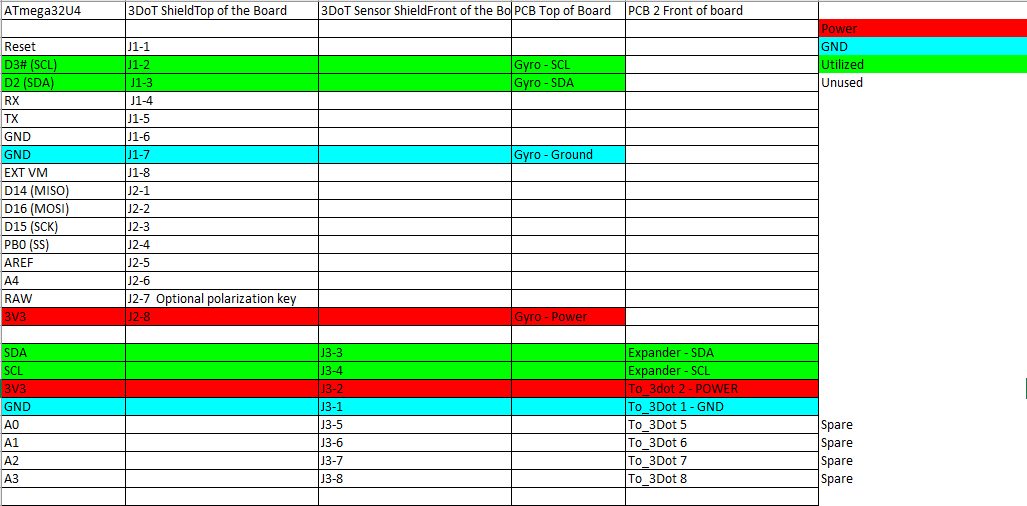
Mass resource report

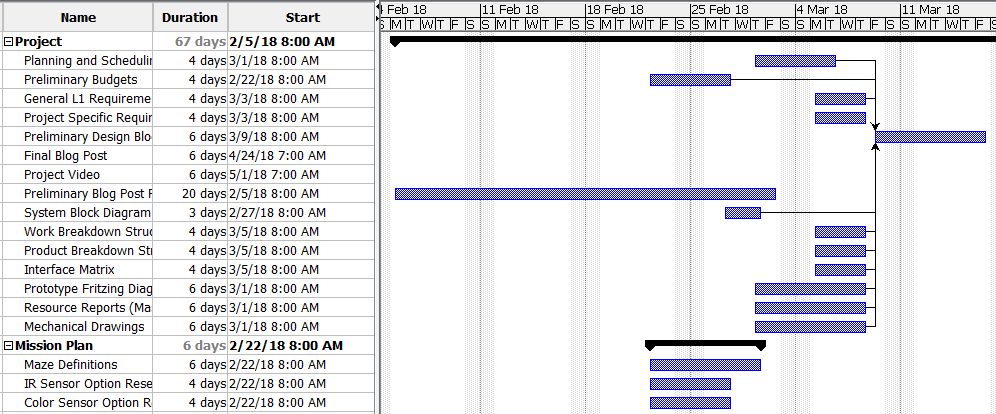
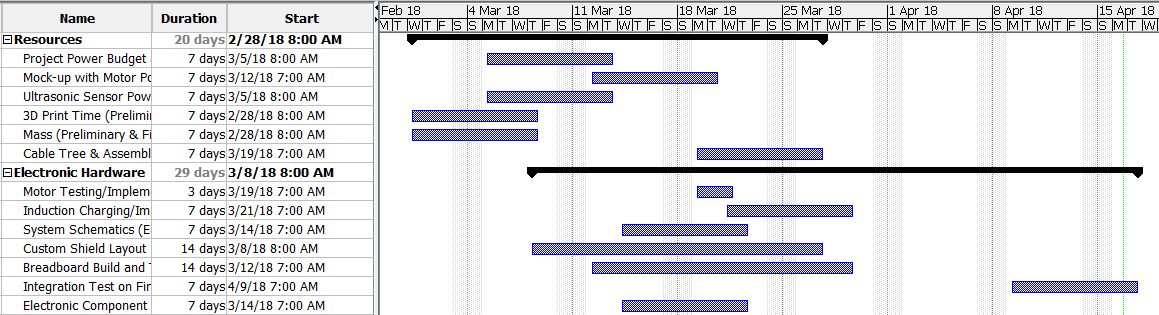
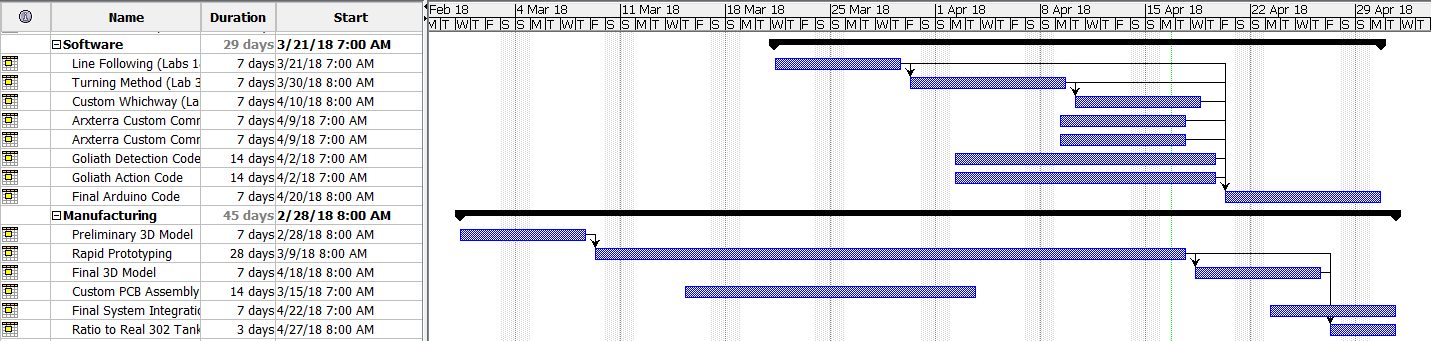
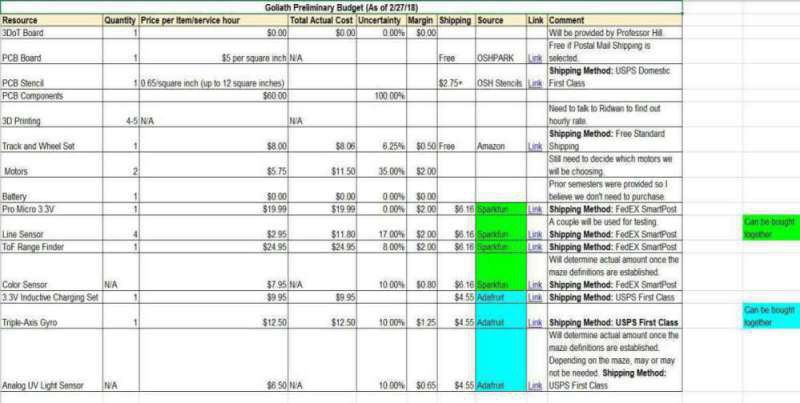
Figure 1: Mass Report
Description:
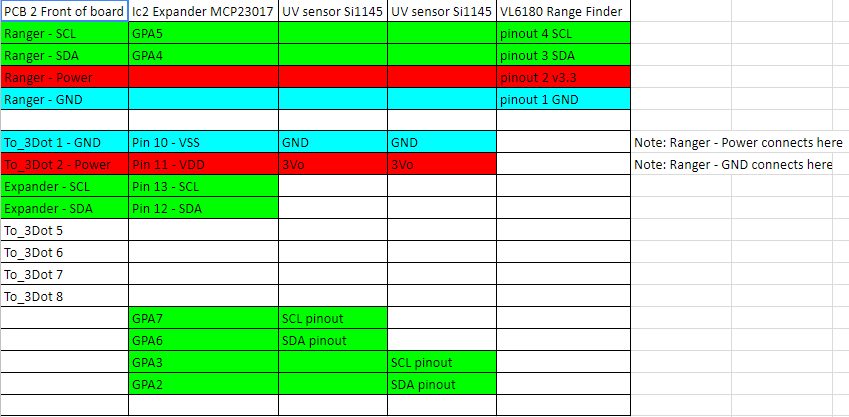
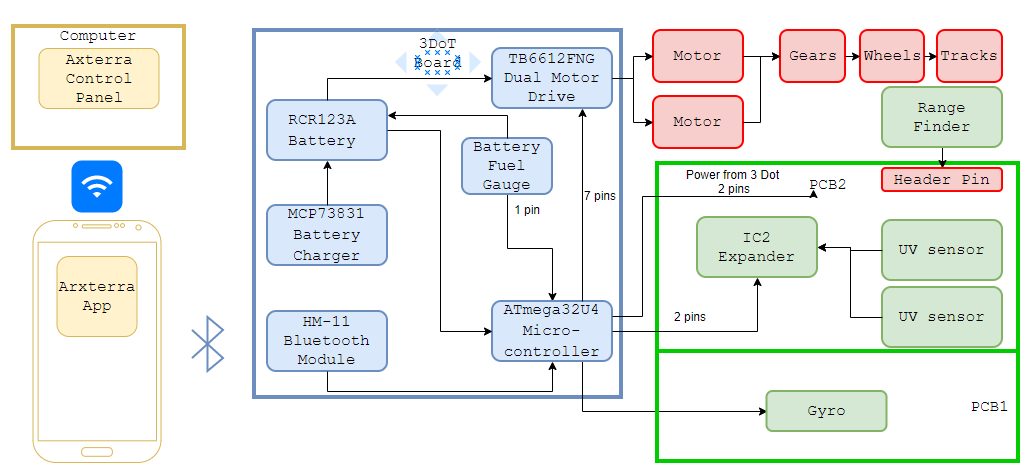
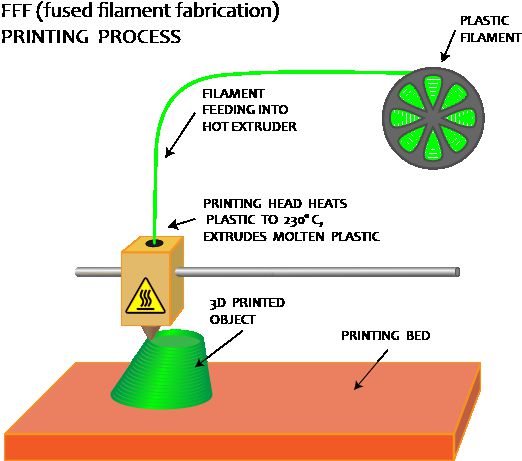
Mass of the AT-ST has been estimated by the given masses on the retailers. The 3D printed parts were estimated by rough calculation shown below. PCB mass was estimated by comparing the size to the 3DoT board size.
All of the parts have been measured on the AT-ST. The total mass came out to be 256.80 grams. There are some parts that have been listed as 0 grams because they have been put together in the body weight.
Measuring the Mass
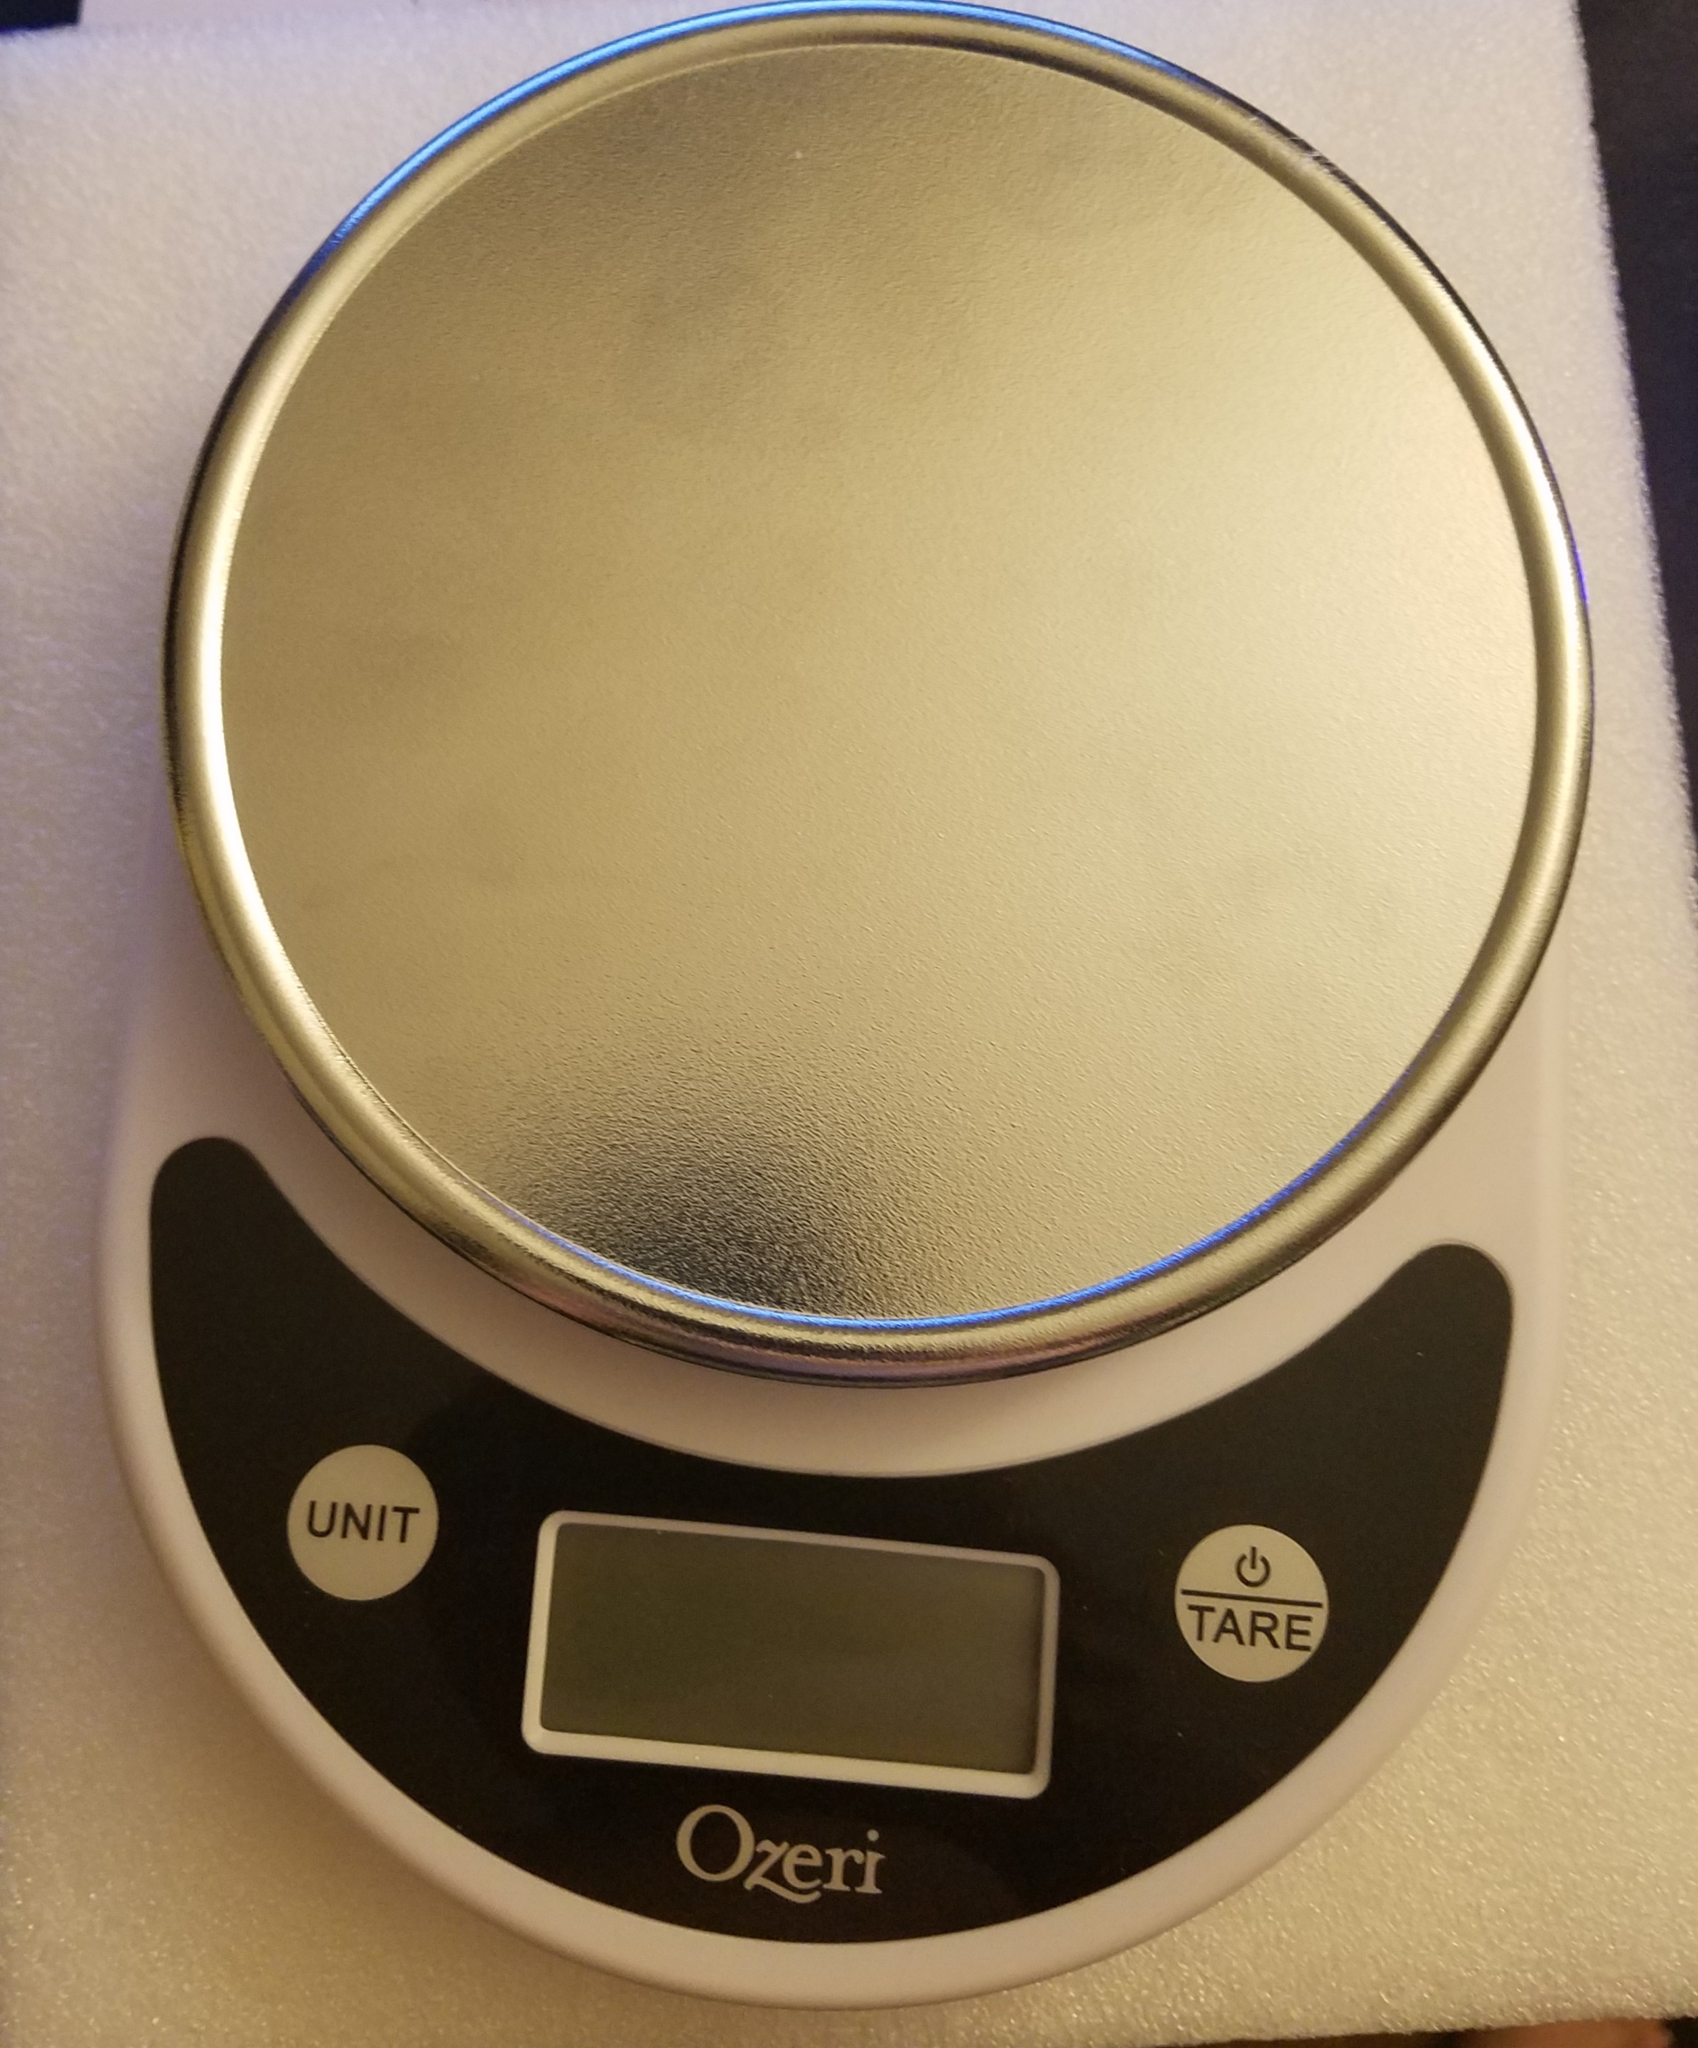
Figure 2: Scale used to measure the mass
Description:
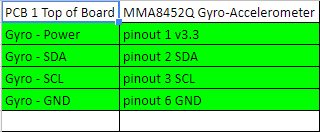
Ozeri pronto digital scale was used to measure the mass of our components. The scale had to be placed on a leveled surface and calibrated by pressing “TARE” button. The weight of the parts was rounded to the nearest gram. I would recommend a scale that has more accuracy for lower masses.
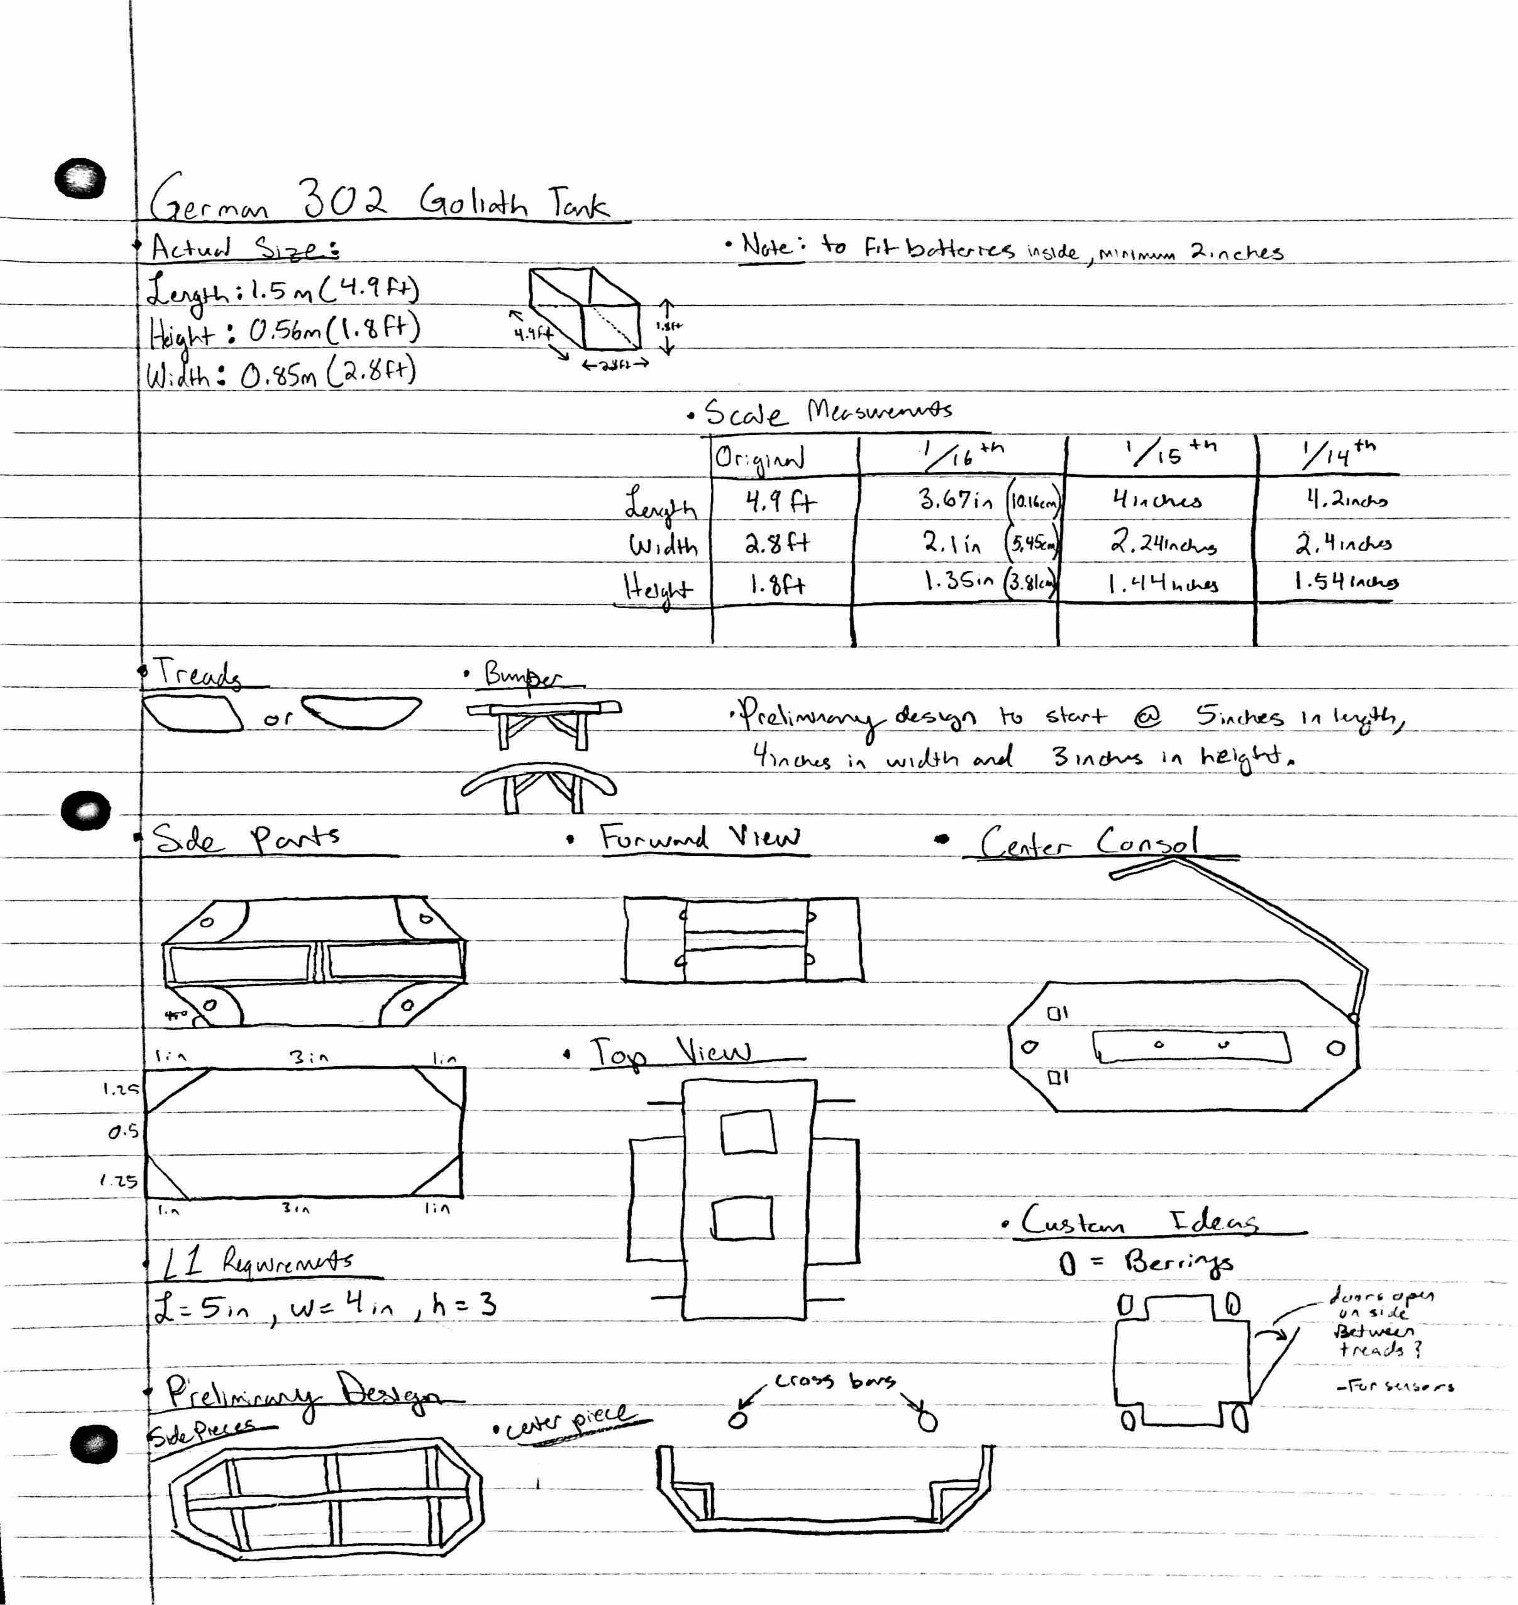
Theo Jansen Leg Dimensions
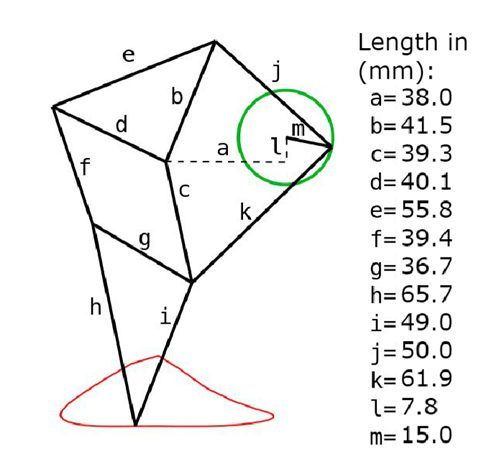
Figure 3: Theo Jansen leg concept
Description
With the Theo Jansen leg dimensions, we are going to estimate the volume of each legs to find the mass of the legs. The Theo Jansen legs will have a width of 3.96875 mm and thickness of 3.825mm.
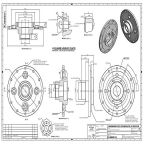
Theo Jansen Leg 3D mechanical drawings (from mechanical drawing blog post)
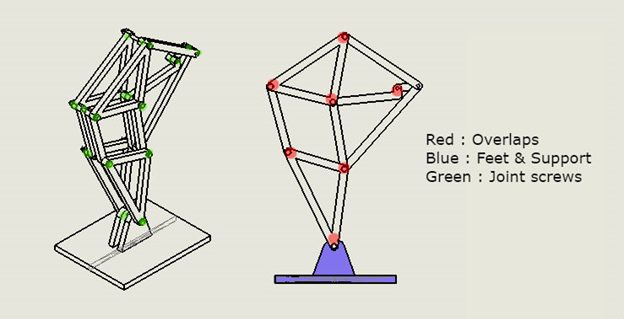
Figure 4: Theo Jansen Leg 3D mechanical drawing
Body (housing for 3DoT and PCB)
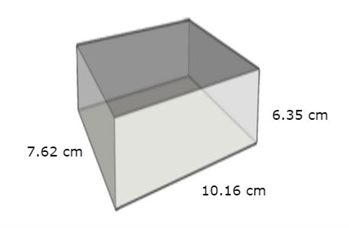
Figure 5: Estimated Body Volume
Calculations
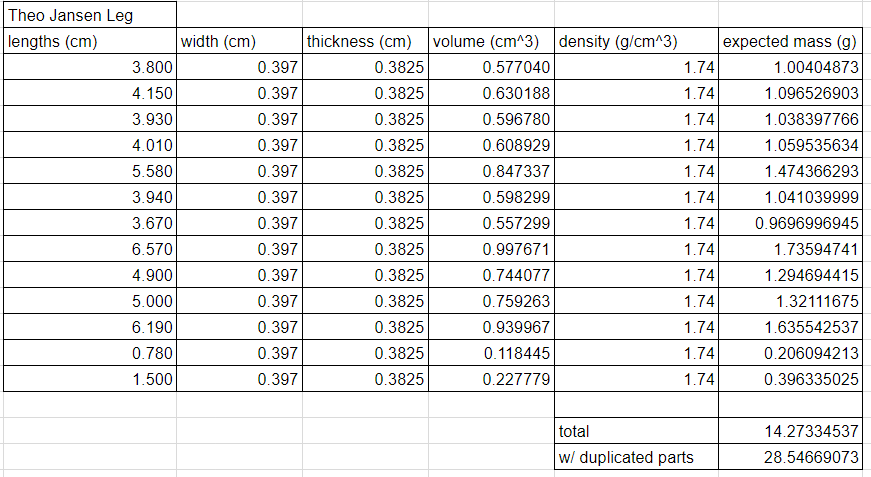
Figure 6: Mass Calculations for Leg

Figure 7: Mass Calculations for supports and Joints
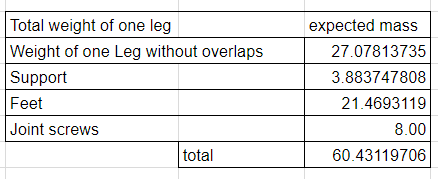
Figure 8: Total Mass for one Leg and Joints
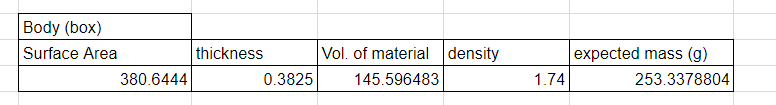
Figure 9: Total Mass Calculation for body (box)
Description:
The legs and body calculations were done by estimating the volume of the 3D printed parts and multiplying their density to them. Since 3D prints do not fill the parts completely with the material, the estimate of the mass will be higher than the actual weight. The mass of the AT-ST 3D printed parts will be around 253 grams for the box and 120 grams for the legs.