Fall 2016 BiPed : Preliminary Project Plan
Gifty Sackey (Project Manager)
Brandon Perez (Systems Engineer)
Ryan Daly (Electronics and Controls Engineer)
Ijya Karki (Manufacturing Engineer)
Table of Contents
Work Breakdown Structure
Gifty Sackey (Project Manager)
The Work Breakdown Structure (WBS) diagram, shows the responsibilities of each BiPed group member. A top level view of the job requirements can able to found in the product breakdown structure provided below. In each division of the product, readers are provided with a detailed explanation of what each team member will be responsible for their part.
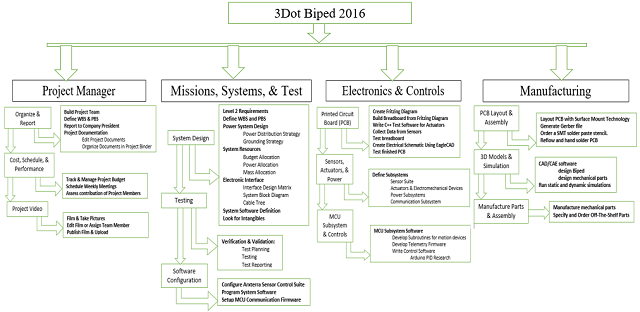
Figure 1 : Work Breakdown Structure
Product Breakdown Structure
The Product Breakdown Structure (PBS) outlines what products are required to be designed by each group over the course of the semester. The PBS is broken down into a consecutive algorithm in order to ensure a successful completion of the product. Note that the blocks, containing what is produced, are not limited to intervention by other team members. The block labeling allows for a broad overview of what each members responsibilities are without going into details of each product.
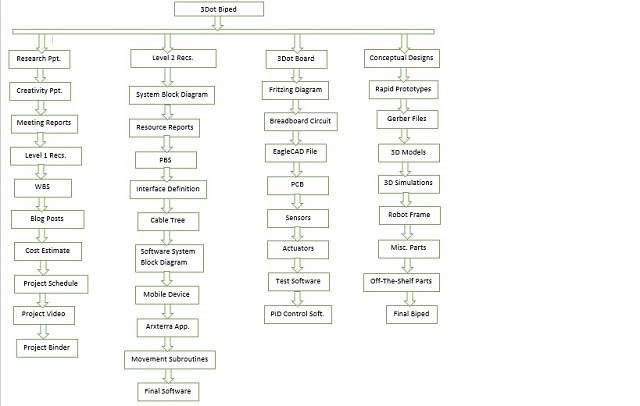
Figure 2 : Product Breakdown Structure
Project Schedule
The project schedule details the necessary work that needs to done to implement the BiPed. In addition to the schedule, a projected timeline of deadlines and dates can also be found. In the link provided, readers can find a visual presentation of what the proposed schedule for implementing the BiPed. ProjectLibre was the tool used to implement the schedule. By manipulating the dates provided, if we are able to refine and solidify our requirements early, it gives us more flexibility with our days for coding; validation tests and also unforeseen events.
https://drive.google.com/file/d/0BzIcuzRpcmk4T3ZYX20wUmlPUmM/view?usp=sharing
Burn down and Project Percent Completion
The project percent completion and burn down chart provides a visual representation of the tasks that needs to be completed for the BiPed. It also allows the team to know how much of the current work load has been done.
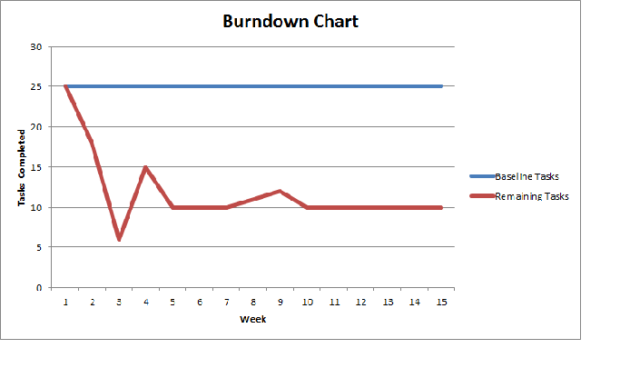
Figure 3 : Breakdown Chart
Project Cost Estimate
The Cost Report summarizes how much each physical part of our product will cost. Details about shipping are not included in each resource since they can be bundled in the same order when ordering multiple parts from the same vendor. Amazon has no shipping charges if the parts are picked up at our Amazon pickup location at our University. The Project Allocation was determined based off what Rofi, the previous BiPed cost to be initially built.

Figure 4 : Cost Estimates
System Resource Reports
Brandon Perez (Systems Engineer)
Mass Report
The mass report summarizes an expected mass of our individual physical products of the BiPed. Most of the items were easy to determine since details about most electronic components contain a mass value on their spec sheets or on their vendor’s website. The PLA Platsic mass was determined based off what the previous BiPed weight. All “Actual Mass” values will be determined when obtaining the physical parts. Project Allocation value is an idealistic estimate of what we think the BiPed’s mass should be limited to.

Figure 5: Mass Report
Power Report
The power report summarizes how much power each electronic component will be consuming. No values shall be needed for the mechanical hardware since power consumption due to kinetic energy will only reflect in the power consumed by our electromechanical devices such as our dc motors and servos. Project Allocation value was determined based off how much constant power our two batteries would supply over the course of an hour.
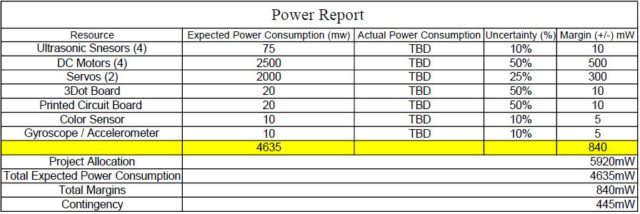
Figure 6 : Power Report