Spring 2016 A-TeChToP Seizure Watch Sensor Testing
By Rose Leidenfrost (Electronics and Control Engineer)
Overview
This blog post provides an outline of experiments used to test the functionality of the sensors used for the wrist worn device. Results conclude the feasibility of the sensor data to be used for seizure detection.
Table of Contents
Electrodermal Activity Sensor
Introduction
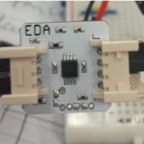
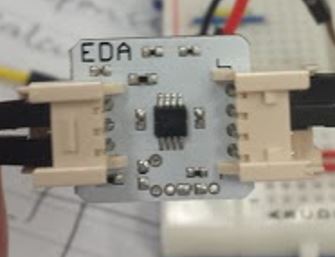
The Bitalino EDA is a standalone sensor for measuring electrodermal activity of the skin. It operates on 3.3 V connected to Vcc, has a gain of 2 and a bandwidth of 0-3 Hz. On the left side two electrodes serve as inputs for the –in and +in pins. On the right, there are pins for Vcc, reference voltage Vcc/2, GND as well as the analog output.
Experiment 1: Skin Resistance
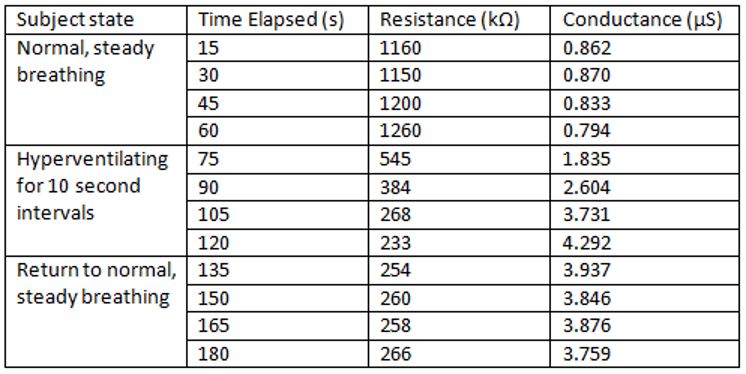
To begin we need to understand what is being measured in terms of electrodermal activity. Electrodermal activity is characterized by skin conductance, similar to electrical conductance it is the inverse of resistance and the units are or specific to skin conductance it is measured in Siemens. The Bitalino EDA is rated for resistance values of 0-1 MΩ, which equates to conductance values of 1.0 μS and greater.
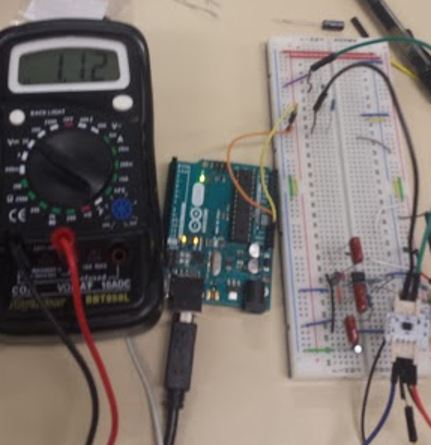
In order to obtain a baseline for normal and stimulated skin conductance, a multi meter is used to measure the resistance across the two electrodes which can be converted to skin conductance. Resistance values are obtained every 15 seconds for 3 minutes in which the subject starts with normal breathing for the first minute and for the second minute the subject is hyperventilating in 10 sec intervals in order to simulate a sympathetic nervous system response which results in an increase in skin conductance. For the last minute the subject returns to a normal steady breath.
Experiment 2: Known Resistor Test
In the next experiment we test the EDA sensor with known resistance values modeling the changing resistance of the skin. The circuit was set up with an Arduino Uno providing 3.3V Vcc to the sensor as well as the reference voltage circuit which was built using a LM358 to obtain approximately 1.6V for the Vref of the sensor. The output of the sensor is connected to a voltmeter to measure the resulting voltage. The goal of this experiment was to simulate changing skin conductance values to obtain a baseline of functionality for the EDA sensor.
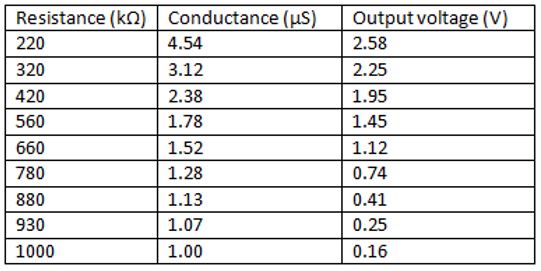
The table obtained shows a typical range of conductance values and the output voltage as a result. This test also ensures that the voltage is within the rated voltage for the Arduino Uno analog pins, which is from 0-5V.
Experiment 3: Arduino Output
In the final experiment, the sensor was tested using an Arduino Uno, reference voltage circuit and disposable adhesive electrodes attached to the ventral side of the distal forearm as shown.
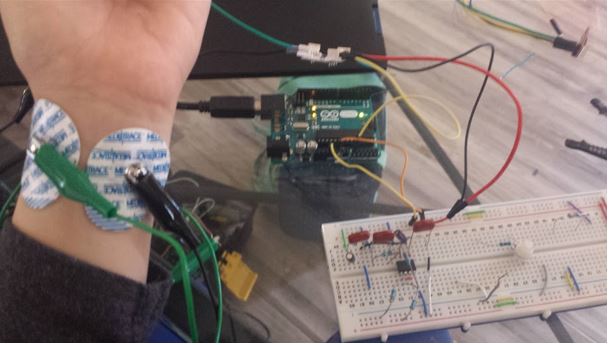
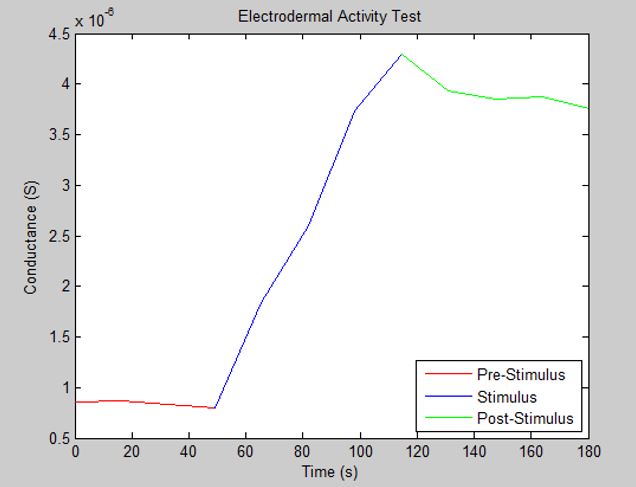
Output was read into the analog pin A0 on the Arduino Uno and viewed using the serial plotter. The subject began hyperventilating in order to simulate a sympathetic nervous system response which is the type of response that would affect electrodermal activity similar to a generalized tonic-clonic seizure [1].
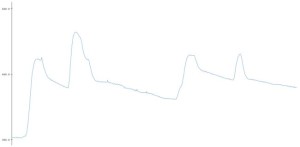
The graph shows the raw signal of the EDA sensor output which does show changes in skin conductance as predicted. The raw data will need further processing and filtering to obtain a signal which may be used for seizure detection.
Accelerometer Testing
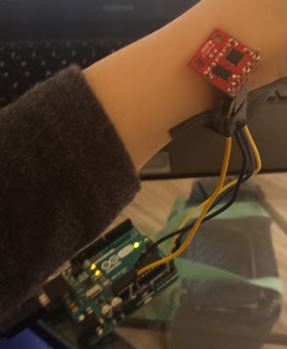
The ADXL345 is the 3 axis accelerometer used for the seizure watch device. The accelerometer senses motion in the x, y, and z directions. Three axis data is sent over I2C pins SDA and SCL, other pins include 3.3V power, ground, Int0 and Int1. The accelerometer was tested using the Arduino Uno connected over I2C with SDA connected to A4 and SCL connected to A5, which are the default pins for I2C. Code for processing the raw data into g’s for the output was obtained from [2]. The output was then viewed using the serial plotter. The accelerometer was affixed to the subject’s wrist to simulate a wrist worn device and the subject performed rapid shaking of the wrist to simulate the motion of a patient experiencing a generalized tonic-clonic seizure.
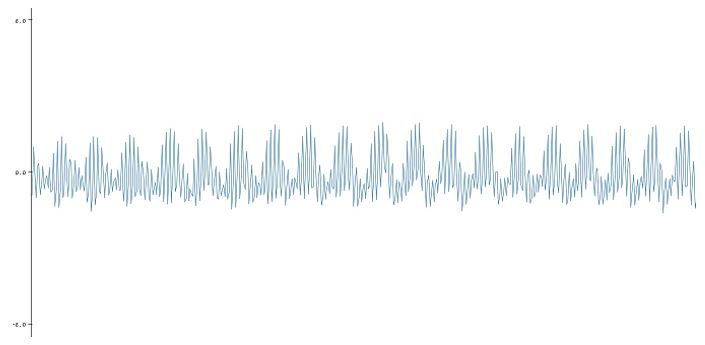
The graph of the output of the accelerometer shows the increase in motion from the subject, in short rapid bursts. This output will be processed and filtered to be combined with the EDA data for seizure detection.
References
[1] Rosalind W. Picard, “Detecting Seizures and their Autonomic Impact with a Wristband” [Online] Available: http://affect.media.mit.edu/projectpages/epilepsy/fullstory.html
[2] Stable Orientation – Digital IMU 6DOF + Arduino (2012) [Online] Available: http://bildr.org/2012/03/stable-orientation-digital-imu-6dof-arduino/